

📝 Blog Summary
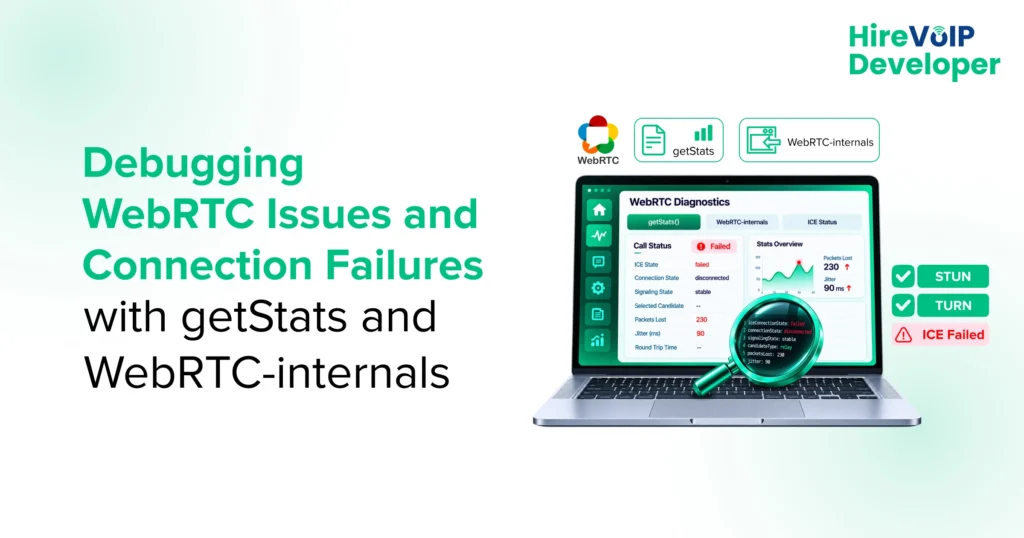
This guide covers how to diagnose WebRTC failures using webrtc-internals and getStats(), including what ICE states and candidate types tell you, which stats reports matter for which symptom, and a symptom-to-evidence map linking each failure to the data that explains it. You’ll also find fixes for STUN/TURN configuration, firewall and mobile network restrictions, and cases where ICE connects but media doesn’t flow, plus a repeatable debugging workflow.
WebRTC doesn’t usually fail by simply saying, “Here is the problem.”
Instead, it leaves clues.
A WebRTC ICE failed state. A candidate pair that never becomes nominated. A relay candidate that never appears. Packets arriving with increasing loss or jitter. Somewhere in those signals is the reason your call failed, but finding it requires knowing which clue to follow first.
That is where webrtc-internals and getStats() become useful. Not because they give you more data, but because they give you a way to trace WebRTC failure back to its source. When these WebRTC issues become harder to isolate, you may need to hire WebRTC developers who can trace the failure across your application, media layer, and network path.
So, where should you look first when your WebRTC connection starts leaving these clues?
What are the Most Common WebRTC Issues?
Most WebRTC issues come from ICE negotiation, restricted network paths, or media transport problems. You may see a WebRTC ICE failed state, a connection stuck at checking, or a call that connects without usable audio or video.
Here are the symptoms worth checking first:
| WebRTC issue | What you should check | Likely cause |
|---|---|---|
| ICE failed | ICE state and candidate pairs | NAT, firewall, or TURN |
| Stuck at checking | Candidate gathering and connectivity checks | Network path |
| Connected but no media | RTP and codec statistics | Track or media issue |
| Poor audio or video | Packet loss, jitter, and RTT | Network instability |
The symptom gives you the starting point, but the connection data tells you where to look next.
Your first clue is usually ICE, so let’s see what those states and candidates are actually telling you.
How to Diagnose WebRTC ICE Failures and Candidate Issues
When you see WebRTC ICE failed, your browser could not find a usable candidate pair for the media connection. Checking the ICE state, candidate types, and selected pair helps you determine whether the failure is due to NAT, firewall restrictions, or TURN, which helps you configure and optimize TURN servers for WebRTC NAT traversal when resolving connectivity issues in restricted networks.
1. Check the ICE Connection State
Your iceConnectionState gives you the first indication of where the connection stands:
- checking: Your browser is testing available candidate pairs.
- connected: A usable candidate pair has been found.
- completed: ICE checks have finished successfully.
- failed: No candidate pair could establish a connection.
- disconnected: The connection may have temporarily lost network connectivity.
If your connection remains stuck at checking, look at candidate gathering and connectivity checks before assuming your media configuration is broken.
2. Which ICE Candidates You Have
Your candidate types can tell you how the browser is trying to reach the other peer:
- Host: Your local network address.
- Server-reflexive (srflx): Your public-facing address discovered through STUN.
- Peer-reflexive (prflx): A candidate discovered during ICE connectivity checks.
- Relay (relay): A TURN server is carrying the media traffic.
If direct candidates fail but a relay candidate succeeds, your network may be restricting the direct path. If you do not see a usable relay candidate when you need one, check your TURN configuration and credentials.
The candidate list tells you what paths are available; the selected candidate pair tells you which path actually won.
Once you know what ICE is doing, your next question is simple: where can you see the evidence?
How to Use WebRTC-internals to Find WebRTC Issues
You can use Chrome’s webrtc-internals to inspect the live evidence behind a WebRTC connection. It shows your ICE states, candidate pairs, connection events, and media statistics, helping you trace where the connection starts to break.
Open chrome://webrtc-internals in Chrome while reproducing the issue. Instead of scanning every graph, focus on a few signals that can narrow your investigation quickly.
1. Check the ICE Connection State
Start with the ICE state and note when it changes.
If your connection moves from checking to connected, ICE has found a working path. If it reaches failed, inspect the candidate pairs and available candidates to understand why the checks did not succeed.
2. Check the Candidate Pair
Look for the candidate pair that becomes selected or nominated.
You can compare the local and remote candidates to see whether your connection is using a direct path or a TURN relay. This can quickly reveal whether the problem is related to NAT, firewall restrictions, or missing TURN connectivity.
3. Check the Event Log and Media Statistics
Your event timeline can show when the connection changed state or encountered an error. Once ICE succeeds, check media statistics for signs of packet loss, jitter, or abnormal RTT.
The goal is not to read every graph in webrtc-internals. It is to connect a specific symptom to the evidence that explains it.
And when you need those same clues from your own application, that’s where WebRTC getStats() takes over.
How to Use WebRTC getStats() for Production Debugging
You can use getStats() to collect WebRTC connection and media data directly from your application. It gives you programmatic access to ICE, candidate-pair, RTP, packet loss, jitter, and RTT statistics that help you diagnose issues beyond a single browser session.
A basic call looks like this:
const stats = await pc.getStats();
stats.forEach(report => {
  console.log(report.type, report);
});
You do not need to inspect every report returned by getStats(). Start with the reports that can explain your specific WebRTC issue.
Which getStats Reports Should You Check?
| Report | What you can investigate |
|---|---|
| candidate-pair | Connection state, nomination, RTT |
| local-candidate | Candidate type and network path |
| remote-candidate | Remote connection path |
| inbound-rtp | Packets received, loss, jitter |
| outbound-rtp | Packets sent and media flow |
| codec | Codecs used for the media stream |
For an ICE failure, start with candidate-pair and candidate reports. If your connection succeeds but media quality suffers, move to inbound-rtp and outbound-rtp.
Fields such as state, nominated, packetsLost, jitter, and roundTripTime can then help you connect the symptom to a likely cause.
The real value of getStats() is that you can collect these signals from your application, not just inspect them manually while reproducing a problem.
Now that you have the data, the real question is: which signal points you to the actual problem?
How to Map WebRTC Symptoms to the Right Diagnostic Evidence
The fastest way to diagnose WebRTC issues is to connect each symptom with the statistic or state that can explain it. Your WebRTC getStats() data and webrtc-internals logs become much more useful when you know exactly what to look for.
| WebRTC symptom | What you should check | What it may indicate |
|---|---|---|
| ICE failed | Candidate-pair state and candidate types | NAT, firewall, or TURN issue |
| Stuck at checking | ICE gathering and candidate-pair states | Connectivity problem |
| Connected but no media | inbound-rtp and outbound-rtp | Track, codec, or media issue |
| High packet loss | RTP packet statistics | Unstable network path |
| High RTT | roundTripTime | Network path or relay latency |
| Works on Wi-Fi but fails on mobile | Candidate and relay statistics | Carrier NAT or restricted network |
For example, if your connection shows as connected but inbound-rtp shows little or no incoming media, ICE may no longer be the issue. You should then investigate tracks, codecs, or the media path, including components such as RTPengine. If you are looking beyond the browser layer, RTPengine explained for SIP WebRTC media handling can help you understand how media is processed between SIP and WebRTC endpoints.
If the same call works on Wi-Fi but produces WebRTC ICE failed on mobile data, compare the candidate types and check whether a usable relay candidate is available. A restricted carrier network may prevent a direct connection, requiring TURN.
The useful question is not simply “Why did my WebRTC call fail?” It is “What does the connection data tell me about where it failed?”
Once your evidence points to the cause, what should you change to restore the connection?
How to Fix Common WebRTC Connection Failures
You can fix most WebRTC connection failures by addressing the specific evidence behind them. Check your STUN/TURN setup for ICE failures, network restrictions for connectivity issues, and RTP or codec data when the connection succeeds, but media does not.
1. Check Your STUN and TURN Configuration
If your direct candidates fail, your TURN server may need to provide the fallback path.
- Verify your TURN server is reachable.
- Check that your credentials are valid.
- Confirm that relay candidates are being gathered.
- Check whether your TURN server supports the required transport.
If you never see a usable relay candidate, your TURN configuration deserves attention before you investigate deeper application logic.
2. Check Firewall and Network Restrictions
Your WebRTC connection may work on an open network but fail behind a corporate firewall, VPN, proxy, or restricted mobile network.
Compare the candidate pairs across these environments. If the failure appears only on restricted networks, check whether UDP traffic is being blocked and whether TURN over an appropriate transport is available.
3. Check Media When ICE Succeeds
If your ICE state reaches connected but users still have no audio or video, look beyond ICE.
Check your media tracks, negotiated codecs, and inbound-rtp or outbound-rtp statistics. This helps you separate a connection problem from a media-flow problem without changing unrelated configuration.
The pattern becomes clearer when you trace each failure from signaling to media, one checkpoint at a time.
WebRTC Connection Debugging Workflow for Production Applications
A reliable WebRTC debugging workflow helps you move from the initial symptom to the underlying cause without checking unrelated settings. You can follow the connection in this order:
Signaling → ICE gathering → ICE state → candidate types → candidate pair → TURN → RTP statistics → network comparison
Start by confirming that your signaling exchange completed correctly. Then check whether your browser gathered usable ICE candidates and whether those candidates produced a working pair.
Once ICE connects, use getStats() to verify that media is actually flowing. If the problem appears only on a particular network, compare its candidate and RTP data with a working environment.
Knowing how to build and maintain this kind of diagnostic workflow is also among the key factors hiring WebRTC developers should account for, especially when your application depends on reliable real-time communication.
This approach gives you a consistent path from “the call failed” to “this specific part of the connection failed.”
With your workflow in place, where does each debugging tool fit when you need to investigate the failure?
getStats vs webrtc-internals for WebRTC Debugging
webrtc-internals helps you investigate a live WebRTC session visually, while getStats() lets you collect connection data programmatically from your application. You can use both together to move from manual debugging to production-level diagnostics.
| Tool | Best use |
|---|---|
| webrtc-internals | Manual browser-level investigation |
| getStats() | Programmatic and production diagnostics |
With webrtc-internals, you can quickly inspect ICE states, candidate pairs, events, and media statistics while reproducing an issue.
With getStats(), you can capture similar signals through your application and use them to investigate issues that occur outside your development environment.
Your best debugging setup does not require choosing one over the other. Use webrtc-internals to understand the failure, then use getStats() to make that visibility useful across real sessions.
You now have the clues, the tools, and the workflow to trace a WebRTC failure from the first symptom to its underlying cause. Let’s wrap it up.
To Wrap Up!
WebRTC issues rarely come down to one mysterious failure. Your ICE states, candidate pairs, TURN path, and RTP statistics each give you a piece of the picture. Once you know how to read those signals together, you can move from guessing to finding the actual cause.
That evidence-first approach is also how Hire VoIP Developer approaches WebRTC and VoIP engineering, tracing issues across your application, WebRTC layer, and VoIP infrastructure instead of treating every failure as an isolated bug.
Still have a doubt about your WebRTC setup or connection issue? Hire VoIP Developer is just a click away.
