


📝 Blog Summary
When a customer complains that a call sounded robotic, checking yesterday’s CDRs won’t tell you why. This blog breaks down how carriers continuously extract RTCP telemetry, calculate algorithmic MOS via the ITU-T E-model, capture SIP/RTP data with HOMER, and isolate asymmetric one-way audio anomalies.
Checking yesterday’s Call Detail Records (CDRs) to troubleshoot audio degradation is a dead end. CDRs confirm that a session connected and show when it ended, but they reveal nothing about the transient network turbulence that occurred mid-call.
In carrier networks and high-density ITSP platforms handling tens of thousands of concurrent sessions, CDRs are blind to transient network chaos. A call can show a normal 200 OK connection and a clean BYE disconnect while the caller actually endured robotic speech, stuttering audio, or 10 seconds of dead silence.
Carrier-grade VoIP monitoring requires shifting from post-mortem log reviews to live media plane observability. That means extracting real-time telemetry from RTP audio streams, computing Mean Opinion Scores (MOS) on the fly, and tracking packet flows across distributed networks without slowing down core switching engines.
Here is the exact blueprint telecom architects use to monitor voice quality across massive, carrier-scale platforms.
What Key Metrics Define VoIP Quality of Service (QoS) for VoIP Monitoring?
Measuring VoIP Quality of Service (QoS) requires tracking five core media plane metrics: packet loss, burst loss distribution, packet delay variation (jitter), round-trip time (RTT), and the resulting Mean Opinion Score (MOS).
Network-level monitoring (like ping times or switch bandwidth saturation) only tells you if a server is alive. It completely misses application-layer voice impairments that scramble human speech:
Packet Loss & Burst Distribution
Standard Packet Loss Concealment (PLC) algorithms can mask a random 1% packet drop. But when packet loss happens in bursts (dropping three or more 20ms audio frames consecutively), words break apart, and syllables vanish completely.
Packet Delay Variation (Jitter)
If RTP packets arrive out of order or with erratic spacing, the receiver’s jitter buffer either starves (buffer underrun, creating audio clicks and gaps) or overflows (buffer overrun, forcing the decoder to drop late-arriving packets).
Mouth-to-Ear Delay (Latency)
Under the official ITU-T G.114 standard, one-way transmission delay between 0ms and 150ms is considered acceptable for general user applications. When one-way delay climbs into the 150ms to 400ms range, network operators must account for noticeable conversational degradation, while delays exceeding 400ms are classified as unacceptable for general network planning.
Frame Erasure Rate (FER)
The actual percentage of voice frames discarded by the receiving audio decoder due to extreme latency or unrecoverable transmission loss.
How Do Telecom Networks Calculate Mean Opinion Score (MOS) in Real Time?
Telecom networks calculate algorithmic MOS in real time by feeding live RTCP packet metrics into the ITU-T G.107 E-model, which outputs a transmission rating factor (R-factor) that maps directly to a 1.0 to 4.5 quality score.
MOS was originally calculated by putting humans in soundproof rooms to rate voice calls on a 1 to 5 scale. In production networks, that rating is computed automatically through the E-model formula:
R = R0 − Is − Id − Ie + A
Where R0 is the base signal-to-noise ratio, Is accounts for speech-level impairments, Id represents delay and latency penalties, Ie measures equipment impairments (such as codec compression distortion and burst frame loss), and A is the mobility advantage factor.
The resulting R-factor translates straight into an objective MOS value:
What Is HOMER VoIP Monitor and How Does It Capture Carrier Media at Scale?
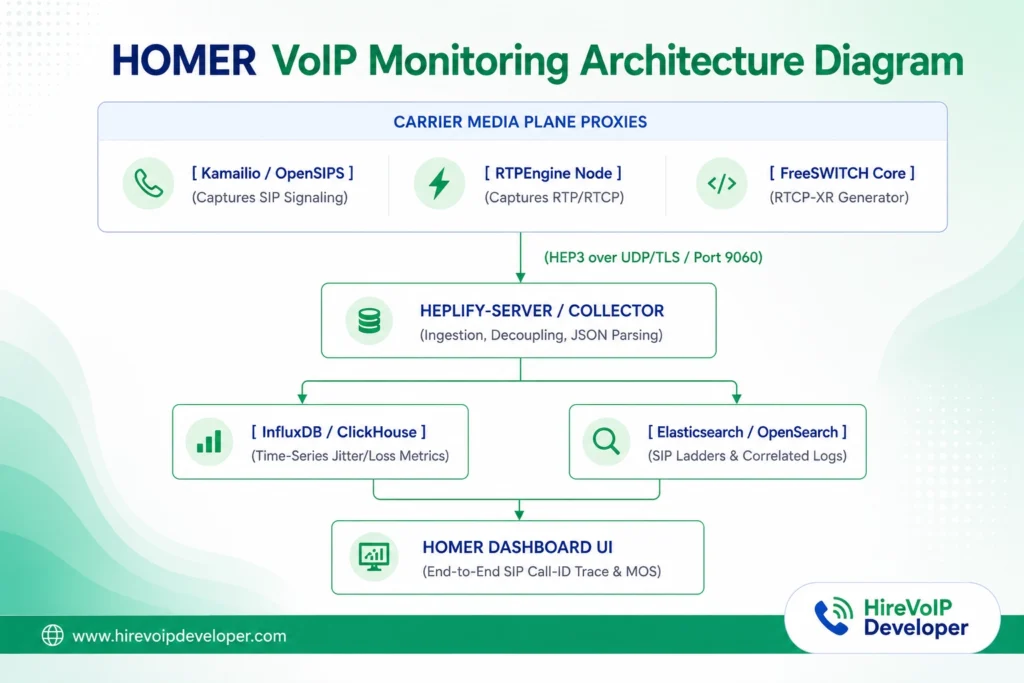
The Homer VoIP Monitor is an open-source, carrier-grade packet capture and monitoring platform designed specifically to visualize SIP signaling ladders, RTP media metrics, and RTCP-XR quality reports without overloading active call processors.
In enterprise systems handling thousands of simultaneous calls, running tcpdump or writing raw .pcap files directly to local server storage will choke disk I/O and drop active calls. The Homer VoIP Monitor solves this by decoupling packet sniffing from metric storage using the Homer Encapsulation Protocol (HEP).
1. In-Memory Extraction via Native SBC Hooks
Instead of writing packets to disk, media proxies (such as RTPEngine, OpenSIPS, Kamailio, or FreeSWITCH) extract RTCP sender and receiver reports directly from memory buffers.
2. HEP3 Encapsulation
The proxy wraps this extracted media telemetry inside a lightweight HEP3 encapsulation packet. This packet includes the original SIP Call-ID, source IP, destination IP, payload type, and precise microsecond timestamps.
3. Out-of-Band Streaming
The media proxy ships these tiny HEP packets over UDP or TLS (port 9060) to a centralized collector (like heplify-server). The core media engine never waits for disk writes or database confirmations, protecting call processing performance.
4. Fast Database Indexing
The collector parses incoming HEP streams into high-speed time-series databases (ClickHouse or InfluxDB) for RTP metrics and distributed text engines (OpenSearch) for SIP signaling. Network engineers can search any Call-ID and inspect a complete, synchronized ladder diagram alongside real-time jitter and MOS graphs in seconds.
💡Expert Tip
Never rely on an aggregate, single-number MOS for a call. Always parse RTCP streams bi-directionally on both the ingress (caller → SBC) and egress (SBC → carrier) legs.
Most chronic audio issues stem from asymmetric route degradation, where the customer leg maintains a pristine 4.3 MOS upstream, while an intermediate wholesale carrier leg suffers severe downlink packet loss. Without directional separation, mean network scoring obscures the faulty hop.
Isolating Asymmetric Routing and One-Way Audio Bugs
You can isolate asymmetric routing and one-way audio bugs by:
- Correlating directional RTP packet counters
- Verifying dynamic NAT port bindings
- Inspecting symmetric RTP latching on your edge Session Border Controller (SBC)
One-way audio is a classic telephony nightmare: signaling completes cleanly (200 OK and ACK are exchanged), but one party hears complete silence. In high-concurrency carrier networks, this happens for three distinct reasons:
1. Asymmetric NAT Port Drops
When a subscriber device sits behind a restrictive NAT gateway, the router allows outbound RTP packets but blocks inbound return audio if the media proxy’s IP or port shifts dynamically. Modern monitoring setups flag this instantly by alerting whenever reverse packet counters stay at zero while forward counters climb.
2. Early Media / 183 Session Timeouts
If an outbound trunk generates early audio (such as custom ring back tones or IVR pre-connect prompts) for longer than 30 seconds without answering, intermediate enterprise stateful firewalls often drop the UDP state mapping. This cuts off the audio path the moment the call actually answers.
3. Transit Peering Congestion
A SIP INVITE signaling path might route over a direct, low-latency link, while the carrier’s reverse RTP audio path gets routed through a cheap, congested secondary transit peer, creating sudden one-way packet loss.
If your engineering team is modernizing carrier infrastructure, preventing these edge routing traps requires structured QA practices. Review our deep dive on the 10 common mistakes to avoid while testing VoIP to ensure your staging test suites validate real-world media plane stress.
How to Prevent Alert Fatigue in VoIP Monitoring?
Telecom platforms prevent alert fatigue by ditching static thresholds and implementing a multi-tier alerting matrix that triggers automated media actions before paging human network operations engineers.
Dynamic Baseline Anomaly Scoring
Static thresholds fail because residential internet traffic naturally experiences higher jitter during evening peak hours. Carrier-grade monitoring platforms calculate rolling 30-day historical averages (μ) and standard deviations (σ) for every individual trunk interconnect:
Trigger Threshold = μhistorical − (2.5 × σ)
If a wholesale carrier’s MOS drops 2.5σ below its normal baseline for that specific hour of the week, the system triggers automated failover long before customers start calling support.
At telecom scale, you can’t fix what you can’t see on the wire. Treating VoIP monitoring as an afterthought leaves your network operations team trapped in reactive fire-fighting mode every time a carrier route hiccups.
By decoupling packet capture with HEP pipelines, continuously calculating G.107 E-model metrics, and tracking directional media hops through the Homer VoIP monitor, you turn voice reliability into a predictable, engineered standard.
If you are ready to eliminate ghost audio issues, automate carrier failovers, or build custom high-capacity observability tools, hire VoIP developers (who have been doing this for quite a while!) to design and scale your media core today.